


A Peek Behind the Curtain - Stats after 6 Months on Substack
A reality check. A look at the numbers, metrics, and lessons learned after posting weekly on Substack for six months.

Over the last six months we’ve been pouring a foundation here. In real life we’d probably start with a blueprint. In this creative space, it’s a little different.
So far, my main goal has been to post something every Saturday. Everything beyond that has been a bonus. The stats below should give you an idea of what that looks like. 8^)
Substack is full of advice on how to grow on Substack. This post is not that.
This is a review of my numbers and what I’ve learned.
As readers, likes and comments are all we see for engagement. The community seems to call those “vanity metrics.” They’re relevant, but more for aesthetics than for function. There’s more to see behind the scenes.
We’ve poured a solid foundation here. I’m excited to share more of what it looks like.
Managing Expectations
Regarding growth, my expectations here evolved in three main stages:
Initial - Thought Substack would bring growth automatically and I would need to manage it. (Not exactly…)
3-5 Months in - Growth was slower than expected, but steady. Tested notes, likes, and comments. Learned what visible actions actually work by watching others. (#1: Engage - post notes, click like, make thoughtful comments)
6 Months - I have a better understanding of what to expect and what I can do to make a positive (or negative) impact on growth.
What you will find below is the reality. There are many like it, but this one is mine. ;p
Substack is a fantastic engine to drive growth, but it doesn’t work on auto-pilot - certainly not at first. It seems most of us, rightfully so, have to spend a little time in the trenches before getting “serious” traction.
Let’s pull back the curtain and take a look at the numbers.

The Stats

As I was finishing this article, another subscriber showed up. Welcome! (don’t mind the number 41 in the other pictures.)
This means the readership here is now about 50/50 — friends and family from real life, and readers who found me through Substack. Thank you for being here!

I initially started with about 25 subscribers. Five of those are my immediate family, so technically the public audience here is now larger than my friends from Facebook. :)
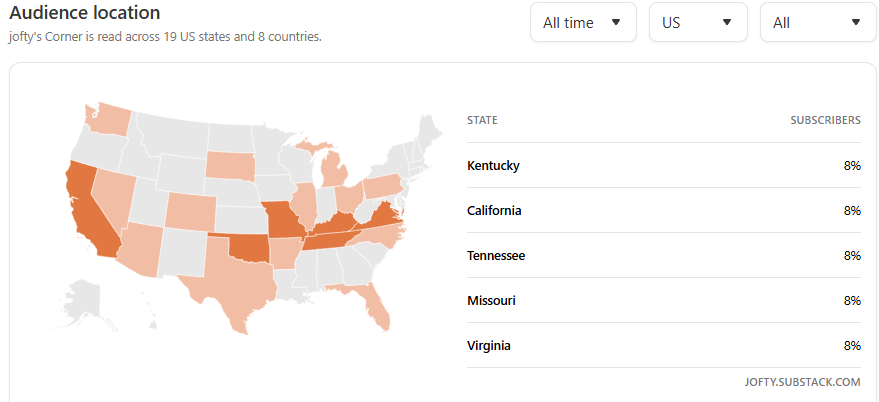
Watching this map grow is fun. This screen is probably the most fulfilling image of progress. The visual of where my writing is being read helps keep things in perspective.

The global numbers are interesting. I have a few friends in Germany, but I have no idea who could be from the UAE, Brazil, or Nigeria. Seeing international reach is exciting. Welcome! :)

The “direct” at the top can be a bit confusing. Half of those 631 views are probably me, but user count is likely accurate.
The email users count is also probably tracked weird, unless my emails are being share a lot more than I think. That should be more like 50.
You can see I haven’t done any advertising or traffic generation outside of Substack.

Looking at my total traffic for this year, I notice two things: The spike near the end of the Burnout series at the end of April, and a drop off in May.
The burnout spike makes sense because I was doing more of “the right things” that month. I posted at least one note daily for 24 days. I also tried to be more active liking and commenting on other posts, but that was fairly inconsistent, and I didn’t track metrics.
The drop in May also makes sense. I backed off a bit this month and haven’t been posting notes or interacting much on Substack. The bulk of the May traffic here is from subscriber email views.

This graph shows a couple of interesting things. First, traffic always drops off by Thursday. It may be because my main traffic driver is my Saturday post, so the impact seems to ‘wear off’ by mid-week. I’ve tried posting extra notes on Wednesday and Thursday to help address the dip, but it hasn’t shown a measurable impact.
I have noticed Thursday mornings feel a lot like Monday mornings with the volume of Substack notifications I receive. It feels like Substack gently nudges creators to add fresh content before the weekend and they respond on Thursday mornings.
The raised floor of measurable daily traffic through the month of April coincides with more active note posting, particularly during the burnout series.
In the last few weeks of May I took a break. You can see what traffic looks like without regular note posting and commenting on other articles. Traffic doesn’t just magically show up. Go figure. ;p

Subscriber growth has been steady over the last 90 days. Unsubscribes happen, flat lines are still common, and the data set is small … but the trajectory is solid. :)

Subscriber growth has been steady all year.
You can see my immediate family hop in at the start and my friends, family, and colleagues sign up shortly after.
The notable climb in late January was likely tied to a big jump in the Substack user base. This platform is growing rapidly as the social media landscape evolves. January and February were huge for Substack.
I watched several other writers see massive spikes in their subscriber count early this year. It was a lot of fun watching others ride the wave!

Follower growth seems to be almost fully organic. Again, a solid trajectory of growth is visible, but the most important thing may be the last few weeks.
As I took a break from posting daily notes (or even opening the app, for that matter) my visibility dropped enough to reflect in the follower stats. I expect that will grow again when I’m posting more notes.
(To clarify, followers see my notes in their feed, but do not receive my articles via email. Every subscriber counts as a follower, but not the other way around.)

Substack Notes provide vital visibility on this platform.
When I stopped posting notes for a few weeks, followers stopped arriving. This looks like causation, not just correlation.

Speaking of notes, this was my most popular one so far.
I pulled this directly out of a burnout missive as I was writing it.
Framing potent ideas in bite size pieces is a skill to hone.
This is the type of ‘content’ I figured I would be dishing out regularly. For some reason, writing small, useful things like this is harder than I expected. This is a skill I believe will improve. :)
If I averaged this level of engagement on one note a day, growth would probably explode.
Note: This isn’t Facebook. If I post a picture of my cat there, the algorithm will make sure a couple hundred of my friends see it quickly. I might expect a dozen reactions in the first 10 minutes. That’s not how things work here. The pace is different. Managing expectations has been an ongoing process.
BTW - I will continue resisting the urge to tempt the Substack algorithm with cat pics. I hear it works for traffic, but that’s a bit too gimmicky (and off topic) for me. :)

These stats from my recent posts paint an encouraging picture.
View numbers are important, but “open rate” is a vital statistic as well. From what I hear, an open rate above 30% is a common goal for a healthy publication. I’ve seen a few articles explaining how writers celebrate achieving open rates in the upper 40s.
You are awesome. Thank you for being here. :)
It’s fair to say that headlines are a main driving factor of view rate. Headlines drive clicks. Crafting engaging headlines that also feel authentic to me is a fun challenge.
Providing consistently high quality, engaging content is probably another open rate factor with a nebulous and lagging indicator.
Full disclosure: I’ve used AI a few times to help make better article headlines with mixed success. Typically, the suggestions sound great, but are unusable because they simply aren’t “me.”

I saved this screen for last because it has some of the most interesting stats.
First, I still haven’t figured out why the open rate was so high for the potpourri post. It was my first potpourri, so maybe that word made it stand out in inboxes. Maybe it was the mention of my first AI experience. The fiery image is likely not a factor because that should impact views from Substack, not email opens.
The AI theory doesn’t work well because the following post was about AI, and is one of only two posts I’ve made with zero likes or comments. It also has a notably low open rate. The enigma deepens because the AI article has become one of my most viewed, yet still least engaged.
I’m a long way from understanding what readers want or predicting how they will react. :)
Important reminder here: “Vanity metrics” aren’t all-important. That article is being read, and that’s what matters.
Additionally, overall open rates ‘normalized’ a bit after the potpourri and AI articles. I was averaging in the upper 40s and sometimes 50s for open rates and that was statistically unsustainable and slightly confusing. (and possibly because friends and family were still a more sizable portion of the subscriber base)
One way or another, those two articles helped align the stats with more realistic or typical numbers.
Bottom Line
The stats look healthy. Perhaps more important… they’re starting to make sense.

The Journey Continues
Thank you, dear reader, for joining me on this journey.
This Substack is maturing. So is my writing. So am I.
If you’ve been here for a while and been curious about what’s behind the curtain, I hope you found this interesting. :)
If you are new to writing or are thinking about starting, I hope you found this info helpful.
If you have any questions or thoughts to share, please leave a comment below, or send me a DM in the Substack app.
I look forward to seeing you again next Saturday. If I post the article I’ve been pecking away at this week, I’ll be very curious to hear your thoughts.
Until then, I hope you have a pleasant week.
Take care,
- jofty 8^)